Quantitative Analysis
Our Analysis
Through the quantitative analysis we have looked at numerous aspects of our business which will be impacted by the surroundings around us. Taking this into account, we have looked in depth at some of these aspects and the way in which they would impact our business.
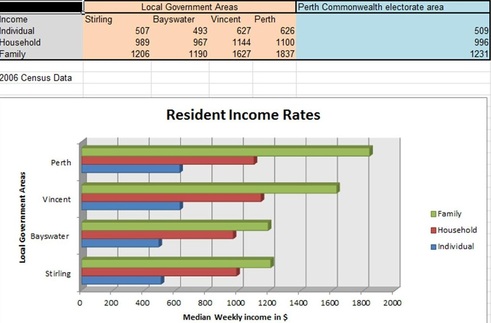
Income Per Household
Firstly we looked at the income per household in our chosen area (Mount Lawley). We used this information to see if the business was financially viable and if there was potential within that area based on the income of the area. From this information we can gather that the area that we have selected to place our business has a reasonably high income which generally means a higher margin of disposable income. This benefits our business and washing the car is considered a luxury and not a necessity. Australian Bureau of Statistics. (2012) Retrieved September 10 2012, from http://www.abs.gov.au/AUSSTATS/[email protected]/Previousproducts/4610.0Main%20Features12008- 09?opendocument&tabname=Summary&prodno=4610.0&issue=2008-09&num=&view=#WA.
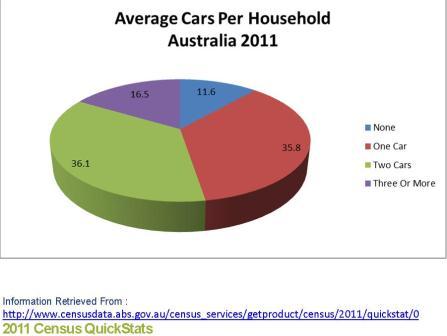
Cars Per Household
Secondly we looked into the number of cars per household on average. This gave us an idea as to if there was enough demand or if there would be enough of a customer base for our business. After viewing the data we can see that 88.4% of the population own at least one car, meaning that there is a large market which our business can enter into.
Cars Per Household
(Research conducted by Marnie)
2011 Census QuickStats. (2011) Retrieved September 7 2012, from http://www.censusdata.abs.gov.au/census_services/getproduct/census/2011/quickstat/0.
Cars Per Household
(Research conducted by Marnie)
2011 Census QuickStats. (2011) Retrieved September 7 2012, from http://www.censusdata.abs.gov.au/census_services/getproduct/census/2011/quickstat/0.
Competitors Within The Area
Lastly we looked into the competitors in the area and what services they offered. This information informed us about what aspects of our business would be in high demand and how much competition they offered. From this information we can see that although there are numerous other businesses that offer the same or similar services, we have the advantage as we offer all services and are mobile, so we cover all categories across the board.
Competitors Within The Area
GoogleMaps (n.d) retrieved September 9 2012, from http://maps.google.com.au/maps?hl=en&tab=wl
Competitors Within The Area
GoogleMaps (n.d) retrieved September 9 2012, from http://maps.google.com.au/maps?hl=en&tab=wl
Water Wastage In Western Australia
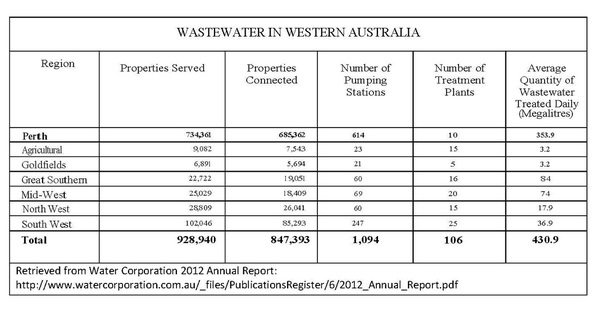
This table shows the amount of waste water that is treated daily across Western Australia.
From this table we can see that Perth has the highest amount of waste water treated daily at 353.9 Megalitres a day.
Using this information our business members decided that our company must place a lot of importance on water usage and water conservation.
Water Corporation. (2012) Water Corporation Annual Report, retrieved October 12 2012, from http://www.watercorporation.com.au/_files/PublicationsRegister/6/2012_Annual_Repport.pdf
The data in the above table shows positive skewed data with the median at 8.40 and the mean value 61.557. The standard deviation is 129.45 this shows a wide spread of data with the kurtosis value of the data at 6.810. The majority of values falling between the third and fourth quartile as per the below quartile values
X min. 3.2
Q1. 5.3
Q2. 8.40
Q3. 27.40
X max. 353.9
This shows that Perth is well above the average leave of treatable water by 17.28%. This data is useful to adapting and implementing new water saving strategies at Wheel Good Car Wash to ensure recycling and minimal wastage of water.
Water usage per household
The table below shows the amount of water per household per State/Territories between 2008-2009. As WA has the highest usage this shows the importance of saving water for Wheel Good Car Wash
Australian Bureau of Statistics. (2012) Retrieved October 12 2012, from http://www.abs.gov.au/AUSSTATS/[email protected]/Previousproducts/4610.0Main%20Features12008-09?opendocument&tabname=Summary&prodno=4610.0&issue=2008-09&num=&view=#WA.
Australian Bureau of Statistics. (2012) Retrieved October 12 2012, from http://www.abs.gov.au/AUSSTATS/[email protected]/Previousproducts/4610.0Main%20Features12008-09?opendocument&tabname=Summary&prodno=4610.0&issue=2008-09&num=&view=#WA.
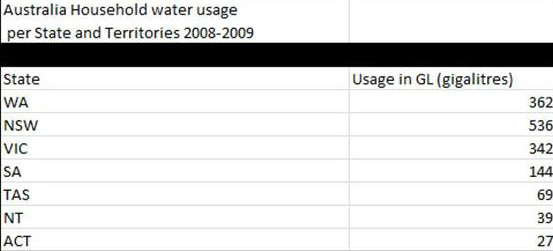
The statistics in the above table shows positive skewed data with the below values calculated
Median: 144
Mean: 217
Range: 509
Variance: 38904.667
Standard deviation: 197.243
Xmin: 27
Q1: 54
Q2: 144
Q3: 352
X max: 362
The above data shows that WA is exceeding the upper quartile of values. This highlights the increasing amount WA households use water compared with the Nation's average of 217 GL. This data will be useful for Wheel Good Car Wash as it highlights the need to be water wise with all services and communicate this to clients.
